배깅(Bagging, Bootstrap aggregating)
기존 Majority voting처럼 개별 분류기를 동일한 훈련 데이터셋에서 학습하는 것이 아니라,

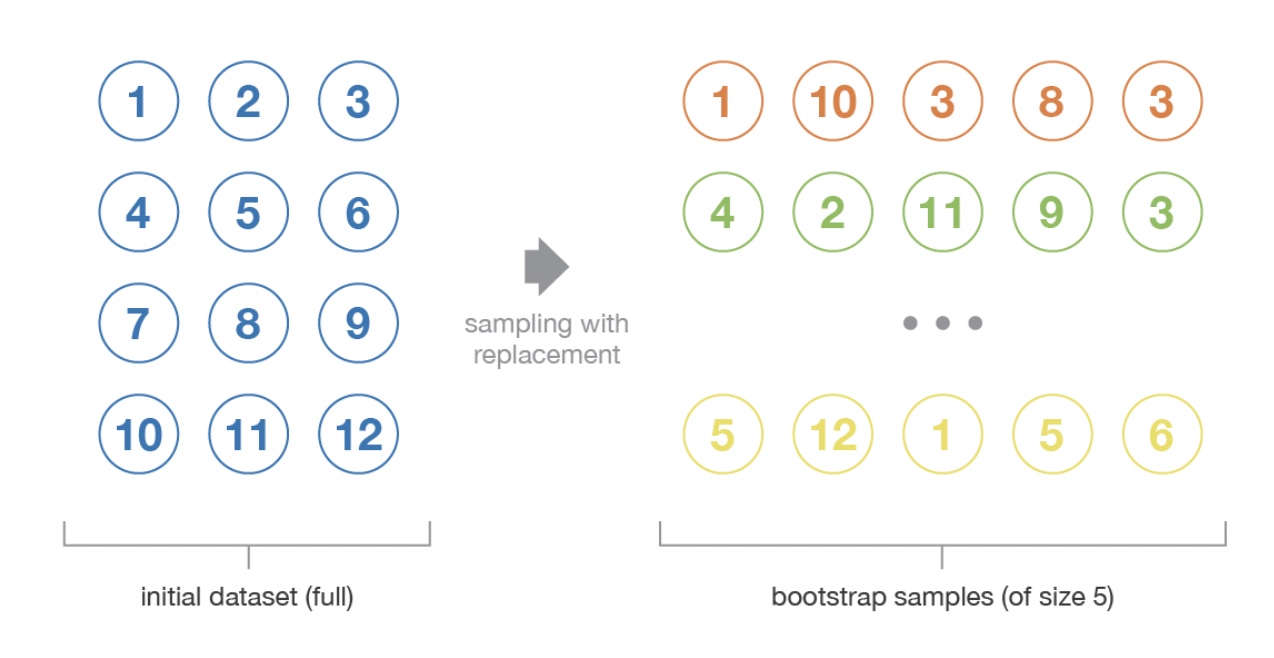
원본 훈련 데이터셋에서 부트스트랩(bootstratp) 샘플을 (중복을 허용한 랜덤 샘플)을 뽑아서 사용한다.


bootstarp aggregating algorithm operating principle
훈련 샘플을 중복을 허용해서 랜덤하게 샘플링한다.
이후 각각의 부트스트랩 샘플을 사용하여 분류기를 학습한다.
(보통은 분류기로 가지치기 하지 않는 결정 트리를 사용한다.)
배깅을 통해 얻은 샘플들은 중복을 허용하기 때문에 부분 집합에는 일부가 중복 되어 있고, 일부는 포합되어 있지 않다.
개별 분류기가 부트스트랩 샘플에 학습되고 나면 다수결 투표를 사용해서 예측을 모은다.
사실 랜덤포레스트 기법은 랜덤하게 특성의 부분 집합을 선택하는 배깅의 특별한 경우이다.
배깅은 불안정한 모델의 정확도를 향상시키고, 과대적합의 정도를 감소시킬 수 있는 기법이다.
배깅으로 Wine 데이터셋 분류
import pandas as pd
df_wine=pd.read_csv('https://archive.ics.uci.edu/ml/'
'machine-learning-databases/wine/wine.data',
header=None)
df_wine.columns=['Class label', 'Alcohol' ,'Malic acid', 'Ash', 'Alcalinity of ash',
'Magnesium', 'Total phenols', 'Flavanoids', 'Noneflavanoid phenols', 'Proanthocyanins',
'Color intensity', 'Hue', '0D280/0D315 of diluted wines', 'Proline']
#클래스 1 제외하기
df_wine=df_wine[df_wine['Class label']!=1]
y=df_wine['Class label'].values
X=df_wine[['Alcohol', '0D280/0D315 of diluted wines']].values
from sklearn.preprocessing import LabelEncoder
from sklearn.model_selection import train_test_split
le=LabelEncoder()
y=le.fit_transform(y)
X_train, X_test, y_train, y_test=\
train_test_split(X, y, test_size=0.2, random_state=1, stratify=y)
scikit-learn BagginClassifier
500개의 결정 트리를 학습하여 앙상블을 만듬
n_estimators의 default value is 10
from sklearn.ensemble import BaggingClassifier
from sklearn.tree import DecisionTreeClassifier
tree=DecisionTreeClassifier(criterion='entropy', random_state=1, max_depth=None)
bag=BaggingClassifier(base_estimator=tree, n_estimators=500, max_samples=1.0, max_features=1.0, bootstrap=True, bootstrap_features=False, n_jobs=1, random_state=1)
배깅 분류기와 가지치기가 없는 단일 결정 트리에서의 훈련 데이터셋과 테스트 데이터셋의 예측 정확도 비교
from sklearn.metrics import accuracy_score
tree=tree.fit(X_train, y_train)
y_train_pred=tree.predict(X_train)
y_test_pred=tree.predict(X_test)
tree_train=accuracy_score(y_train, y_train_pred)
tree_test=accuracy_score(y_test, y_test_pred)
print('결정 트리의 훈련 정확도/테스트 정확도 %.3f/%.3f' %(tree_train, tree_test))
결정 트리의 훈련 정확도/테스 정확도 1.000/0.833
훈련 데이터 정확도는 높지만 테스트 정확도는 낮은 걸 볼 수 있다. 이는 데이터가 과대 적합되었다고 알려준다.
bag.fit(X_train, y_train)
y_train_pred=bag.predict(X_train)
y_test_pred=bag.predict(X_test)
bag_train=accuracy_score(y_train, y_train_pred)
bag_test=accuracy_score(y_test, y_test_pred)
print('배깅의 훈련 정확도/테스트 정확도 %.3f/%.3f' %(bag_train, bag_test))
배깅의 훈련 정확도/테스트 정확도 1.000/0.917
결정 트리와 배깅 분류기 모두 훈련 정확도가 훈련 데이터셋에서 비슷하지만,
테스트셋의 정확도를 봤을 때, 배깅 분류기가 일반화 성능이 더 뛰어남을 알 수 있다.
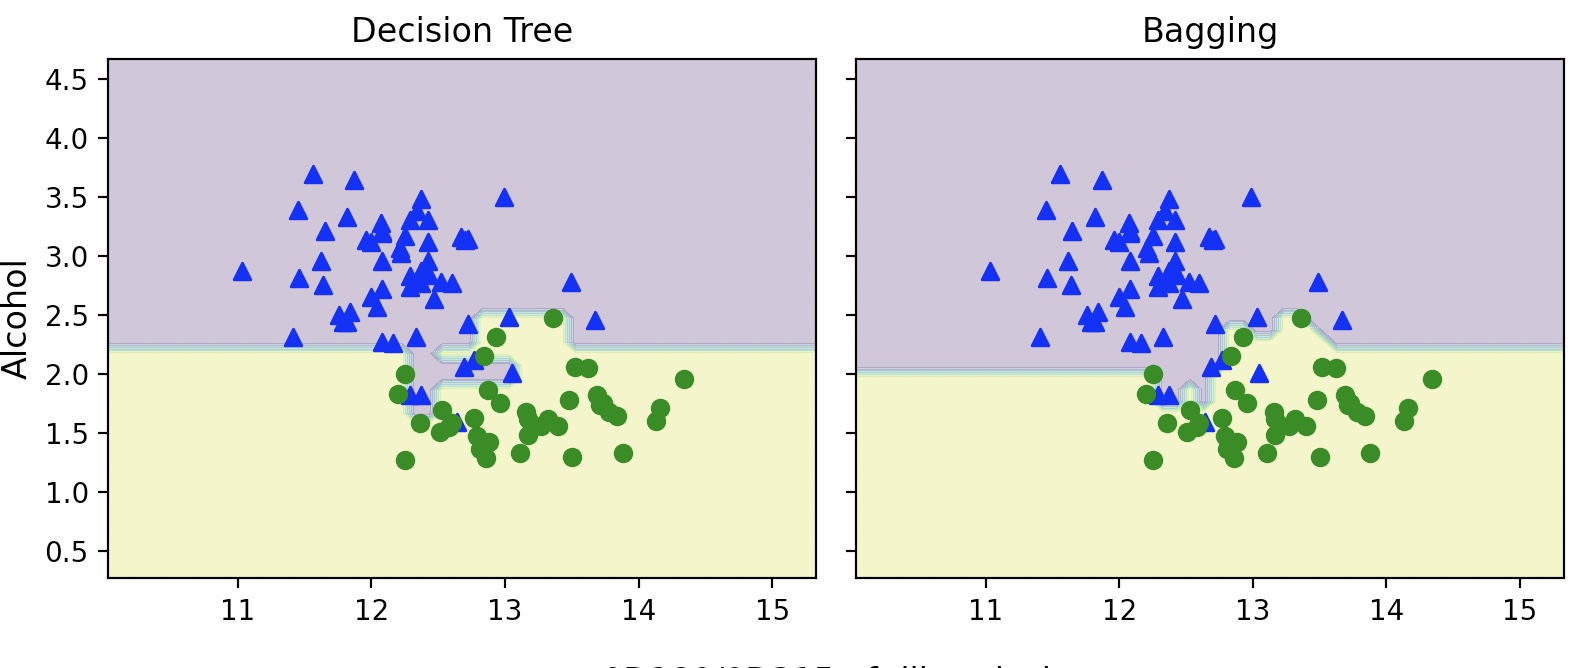
결정 경계 비교
import numpy as np
import matplotlib.pyplot as plt
x_min=X_train[:, 0].min()-1
x_max=X_train[:, 0].max()+1
y_min=X_train[:, 1].min()-1
y_max=X_train[:, 1].max()+1
xx, yy=np.meshgrid(np.arange(x_min, x_max, 0.1), np.arange(y_min, y_max, 0.1))
f, axarr=plt.subplots(nrows=1, ncols=2, sharex='col', sharey='row', figsize=(8, 3))
for idx, clf, tt in zip([0, 1], [tree, bag], ['Decision Tree', 'Bagging']):
clf.fit(X_train, y_train)
Z=clf.predict(np.c_[xx.ravel(), yy.ravel()])
Z=Z.reshape(xx.shape)
axarr[idx].contourf(xx, yy, Z, alpha=0.3)
axarr[idx].scatter(X_train[y_train==0, 0], X_train[y_train==0, 1], c='blue', marker='^')
axarr[idx].scatter(X_train[y_train==1, 0], X_train[y_train==1, 1], c='green', marker='o')
axarr[idx].set_title(tt)
axarr[0].set_ylabel('Alcohol', fontsize=12)
plt.tight_layout()
plt.text(0, -0.2, s='0D280/0D315 of diluted wines', ha='center', va='center', fontsize=12, transform=axarr[1].transAxes)
plt.show()

Decision Tree보다 Bagging 앙상블에서 결정 경계가 더 부드러워졌다.
Bagging 앙상블이 과대 적합 정도가 더 적다.
배깅 알고리즘은 모델의 분산을 감소시키는데 효과적인 방법이지만, 모델의 편향을 낮추는 데는 효과적이지 않다.
배깅을 수행할 때, 가지치기 하지 않은 결정 트리를 분류기로 사용하여 앙상블을 만드는 이유이다.(편향이 낮음)
랜덤 포레스트와 배깅 모두 기본적으로 부트스트랩 샘플링을 사용하기 때문에,
사용하지 않는 데이터 OOB(Out of Bag) 샘플이 존재한다.
이를 사용하면 검증데이터를 만들지 않고 모델을 평가할 수 있다.
사이킷런에서 oob_score 매개변수를 True로 설정하면 된다.(default는 False이다.)
사이킷런에서 랜덤 포레스트의 분류일 경우 OOB 샘플을 이용해서 각 트리의 예측 확률을 누적하여
가장 큰 확률을 가진 클래스를 타깃과 비교하여 정확도를 계산
(회귀의 경우 R^2점수를 계산)
위의 점수는 oob_score_ 속성에 저장된다.
from sklearn.ensemble import RandomForestClassifier
rf=RandomForestClassifier(oob_score=True, random_state=1)
rf.fit(X_train, y_train)
print('랜덤 포레스트의 훈련 정확도/테스트 정확도 %.3f/%.3f' %(rf.score(X_train, y_train), rf.score(X_test, y_test)))
print('랜덤 포레스트의 OOB 정확도: %.3f' %rf.oob_score_)
랜덤 포레스트의 훈련 정확도/테스트 정확도 1.000/0.917
랜덤 포레스트의 OOB 정확도: 0.884